

Working as a Project Manager for multiple for-profit and not-for-profit organizations I have seen a lot, I mean a lot, of project reports. Some of the places I’ve had the opportunity to work for are really in to project reporting, some not so much.
Learning Big Data tools I’ve often had questions of my own that I’ve asked myself. One was, can I get a measure of project report “quality” without actually reading the report? Can I look at all the reports in the organization and find good project report writers? Can I find projects that consistently produce good project reports? Bad project reports? How do my own project reports stack up to others? How does the “quality” of the project reports change over time? Does project report “quality” have any relationship to project “quality”?
Thinking it I decided there were two measures that seemed important to me as I read and reviewed project reports; did they say something new and how much effort went into the report.
Uniqueness –computed from the number of unique words in each of a project’s narrative reports (perhaps just one type of many reports that might be required) compared to all the words used in the project’s narrative reports to date. (As a technical note this uniqueness number decreases over time as it is more and more difficult to write unique content in project reports. To straighten out this effect the log of the number of unique words is used in comparisons between projects.)
Effort – calculated as the number of photos and other documents submitted with the narrative report.
I assume that “Uniqueness” and “Effort” are valid proxy measurements for good project report writing, which is a valid proxy measure for good project monitoring, which is a valid proxy measure for good project implementation…
All this was done by calculating the size of the initial Bag of Words (BoW) for the very first project narrative report and then comparing that to the size of BoWs for subsequent project narrative reports over the life of the project.
What I found was that I couldn’t convince myself that the size of the initial BoW was significant. It seems that the Fields Effect is fully operational with initial project narrative reports:
 “If you can’t dazzle them with brilliance, baffle them with bullshit.” ― W.C. Fields
https://en.wikiquote.org/wiki/W._C._Fields
However, the relative BoW size of the subsequent projects was telling. My very unscientific selection process of reports to test showed that I could classify project reports over the project life into below average, average, and above average.
There looks to be a linear relationship between time and the log of the size of the project narrative report’s BoW. This Uniqueness slope represents a sustained effort to include new information into project narrative reports. It turns out that Effort was highly correlated with Uniqueness, which shouldn’t have been a surprise.
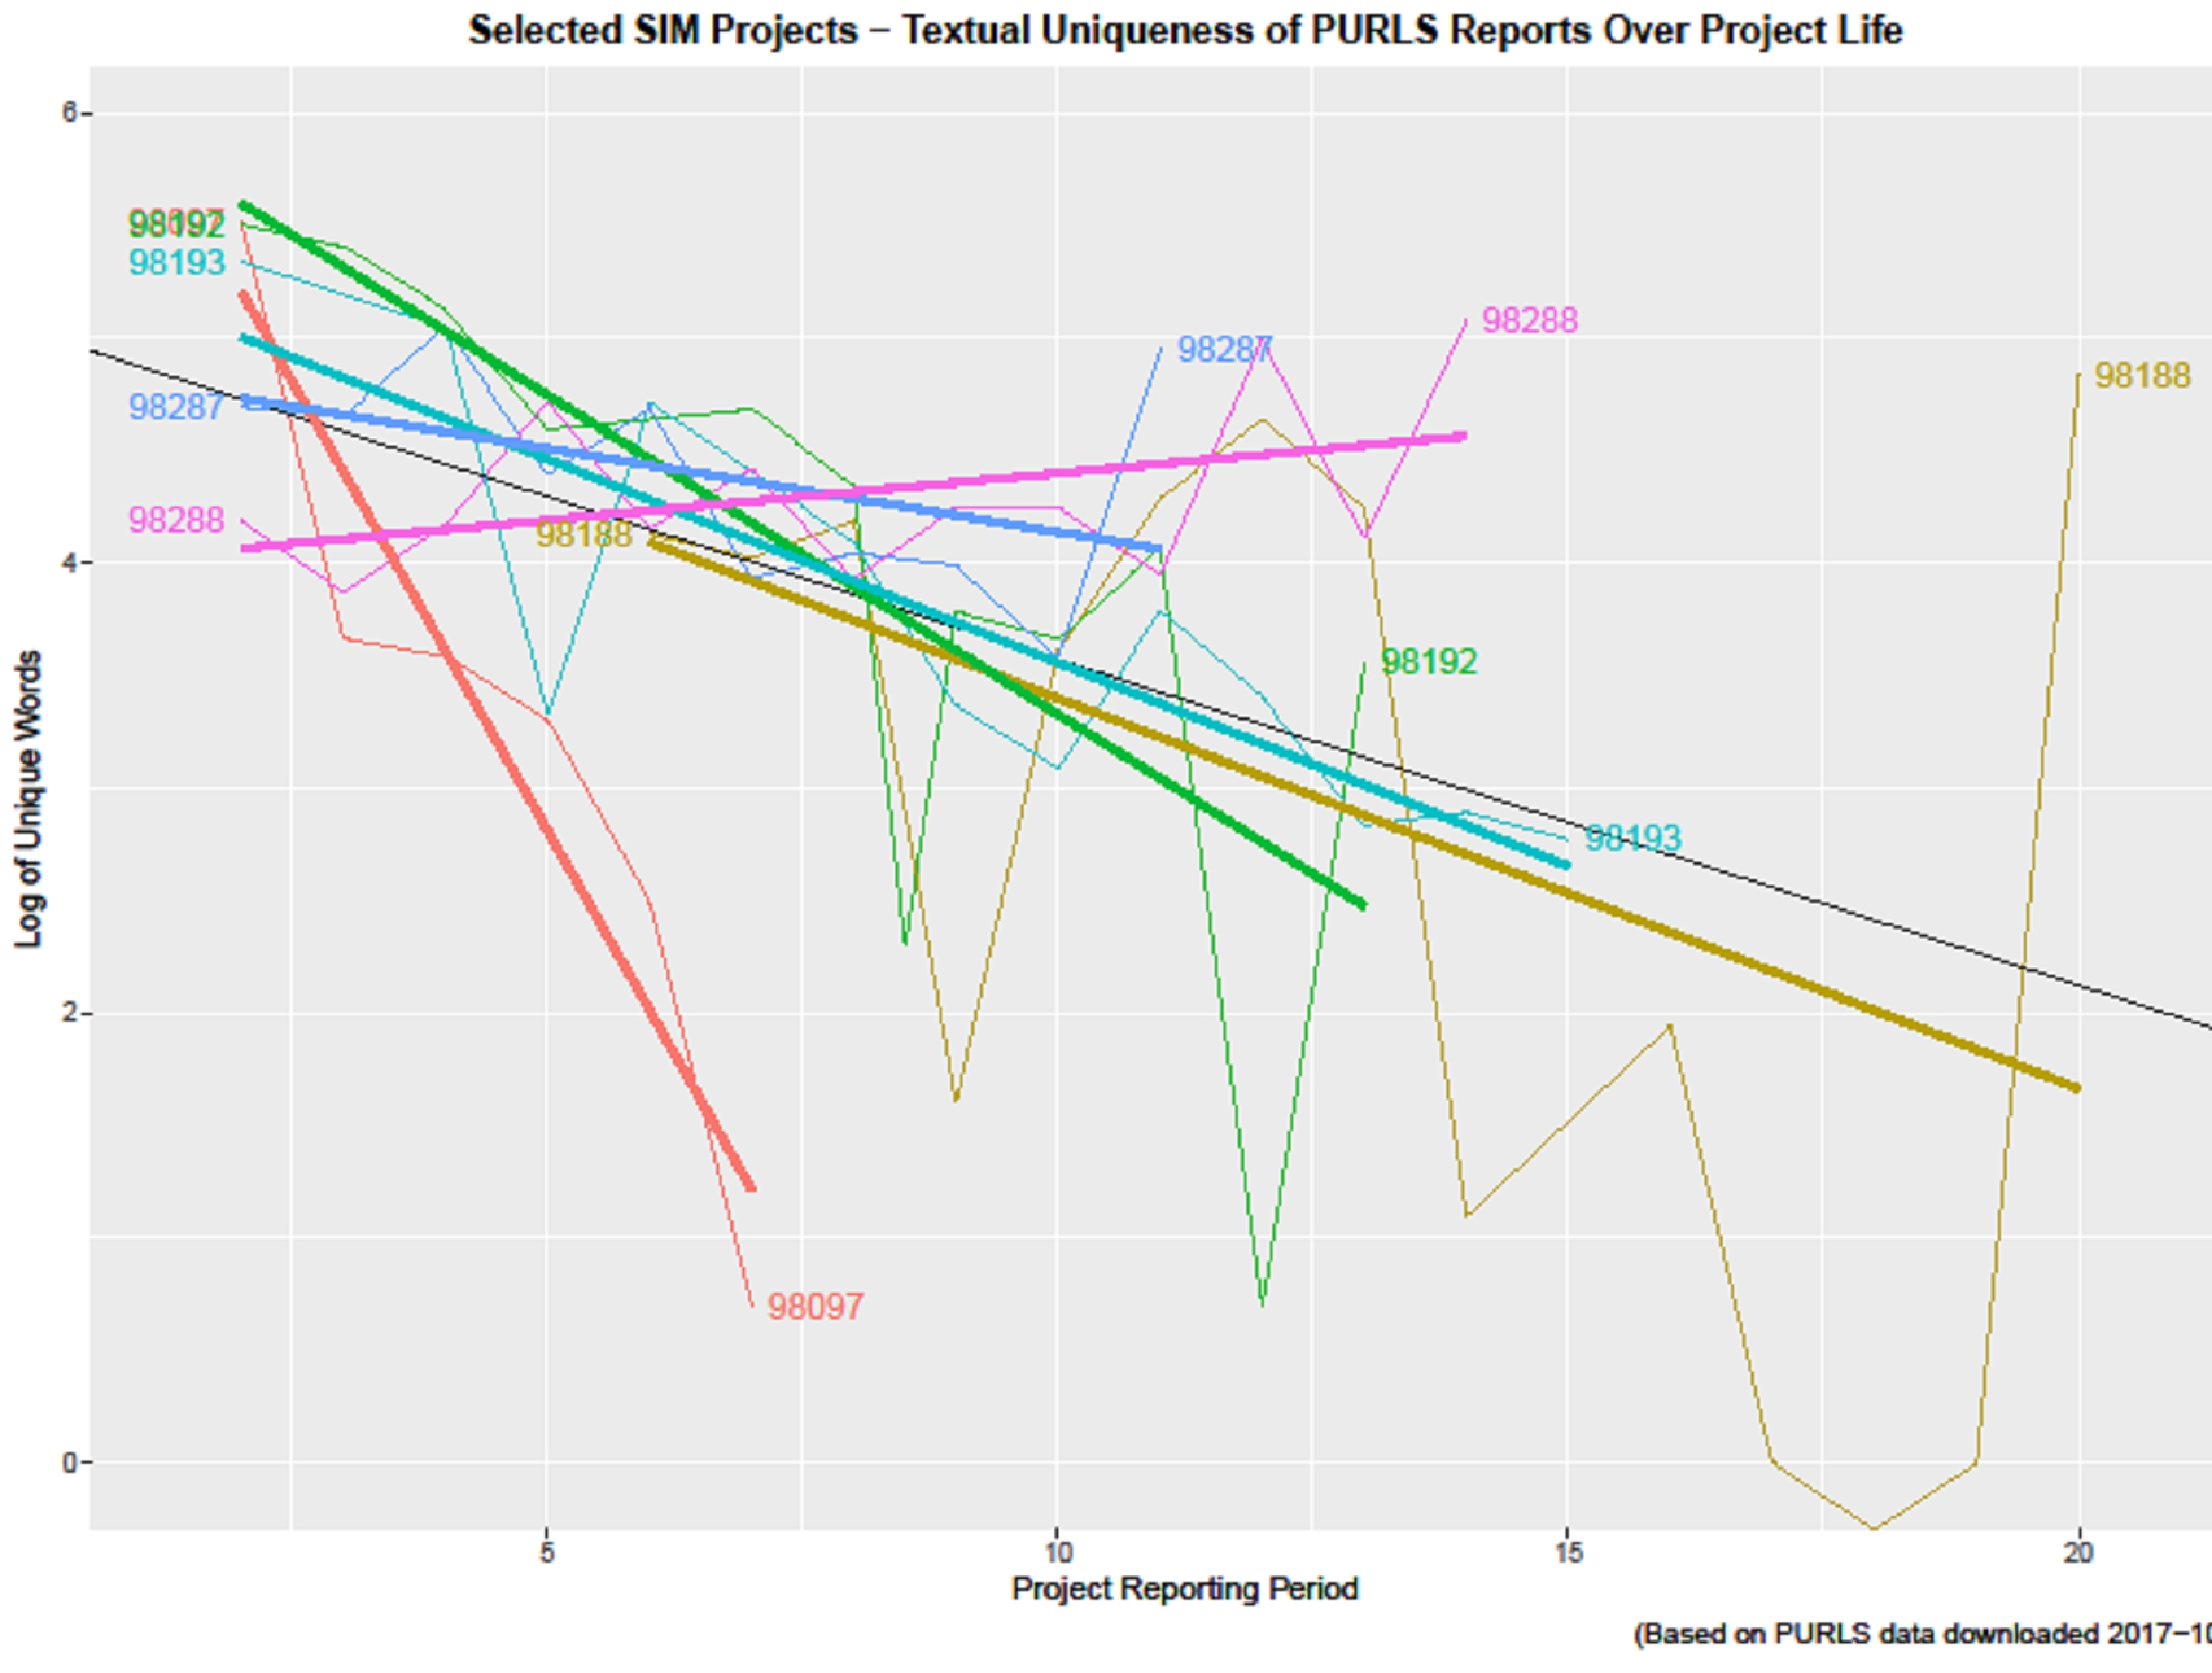
My graph shows trends overlaying raw data for a bunch project reports over the life of the projects. Clearly there is a below average group, an average group, and an above average group.
Perhaps an automated project report quality checker can be developed…
Bag-of-words model. (2017, September 8). In Wikipedia, The Free Encyclopedia. Retrieved 23:20, October 12, 2017, from https://en.wikipedia.org/w/index.php?title=Bag-of-words_model&oldid=799590423